After more than a year of living through COVID-19, the worst of the pandemic in the U.S. appears to be over. Daily cases peaked in early January at more than 250,000 per day, but ever since, the U.S. has seen sharp declines in COVID-19 positive cases, even as more contagious variants have emerged. Now, the U.S. is looking toward a summer that might finally look a little closer to normal.
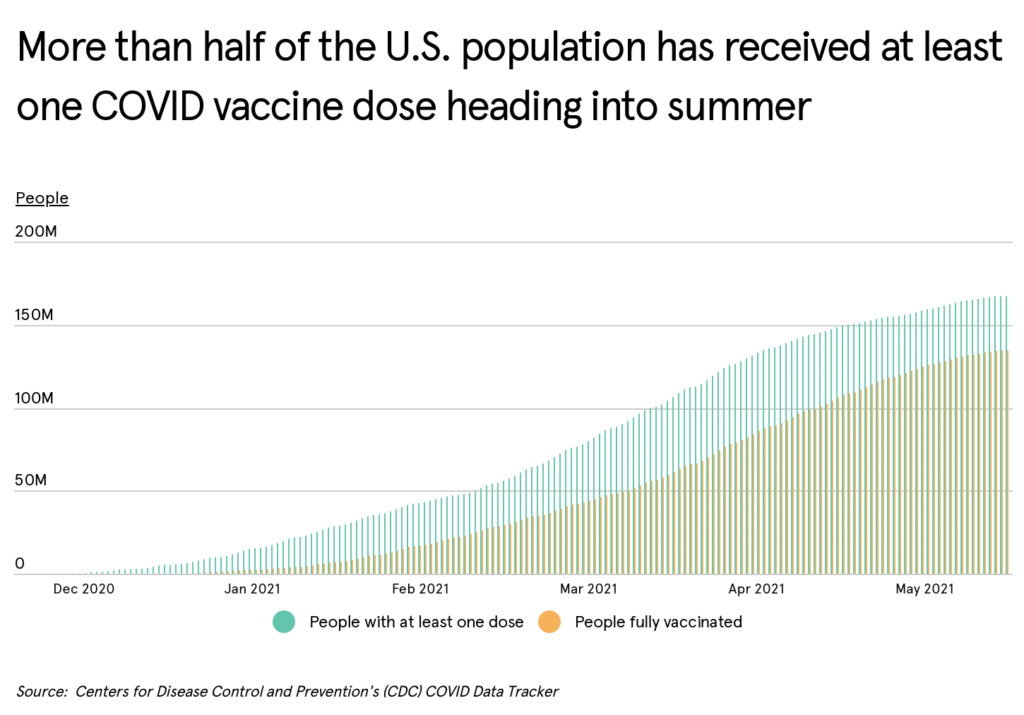
One of the biggest factors in the wind-down of the pandemic has been the availability of COVID-19 vaccines. COVID-19 vaccines first became available for select populations in December 2020, and by late April, any U.S. adult was eligible to get the Pfizer, Moderna, or Johnson & Johnson vaccine. According to data from the Centers for Disease Control and Prevention, more than 50% of the total U.S. population had received at least one dose as of the beginning of June, and 41% of the population was fully vaccinated.
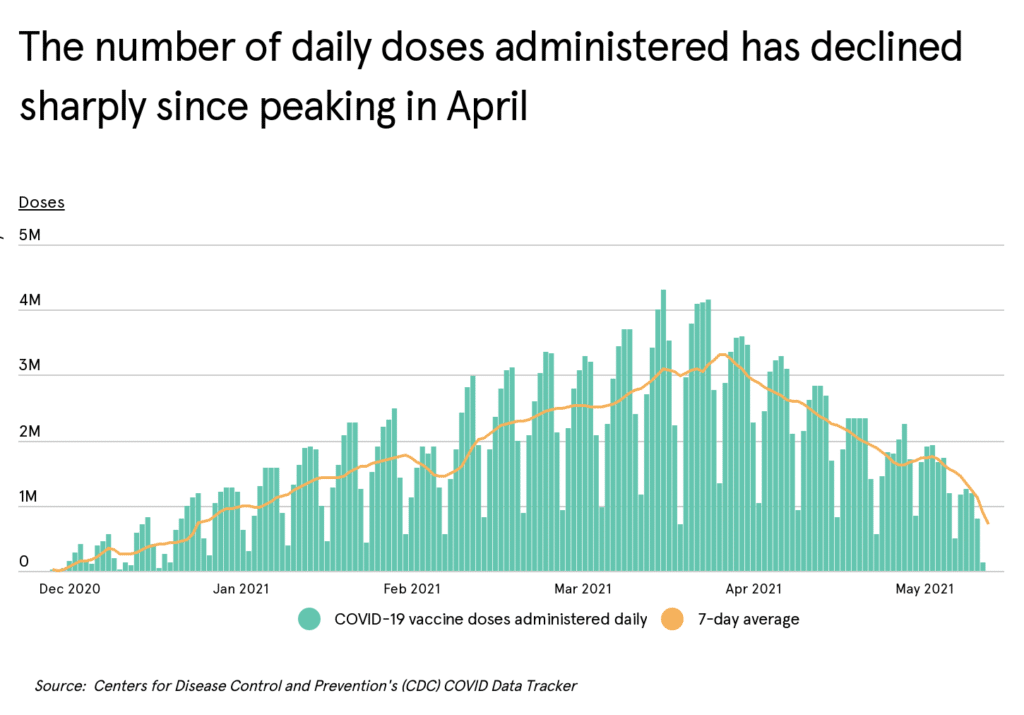
Going from zero vaccinated individuals to more than half the population in a span of six months is no small feat, and vaccination trends showed impressive growth early in the year. After an initially bumpy rollout, daily doses administered averaged 1 million in mid-January, 2 million in early March, and 3 million at the beginning of April—including several days with more than 4 million doses administered. In total, nearly 300 million doses had been administered by the end of May.
However, public health officials have since become increasingly worried at slowing rates of vaccine administration. Experts believe that the population is still far off from reaching herd immunity to the coronavirus through vaccinations, but overall demand for the vaccine has nonetheless tapered off throughout the spring. The 7-day average of doses administered peaked at around 3.3 million on April 11, but by the end of May, that figure had dropped below 1 million doses per day—even though it is easier than it has ever been to get the vaccine.
One of the key issues in vaccine administration has been vaccine skepticism. Public health experts have long anticipated that there would be hesitancy around the safety and efficacy of COVID-19 vaccines, especially given the accelerated Food and Drug Administration process to get the immunizations approved. Reports of unpleasant side effects have also been a major source of hesitancy. These concerns may have been exacerbated by the temporary pause to the Johnson & Johnson vaccine rollout in April after a handful of patients developed blood clots after receiving the single-dose shot.
Others are skeptical of the risks of COVID-19 at this stage in the pandemic. Many individuals who have previously tested positive for the virus have declined to take a vaccine, believing themselves to be safe from future infections due to natural immunity. And as COVID-19 cases have taken a steep decline, some feel the virus no longer poses a threat.
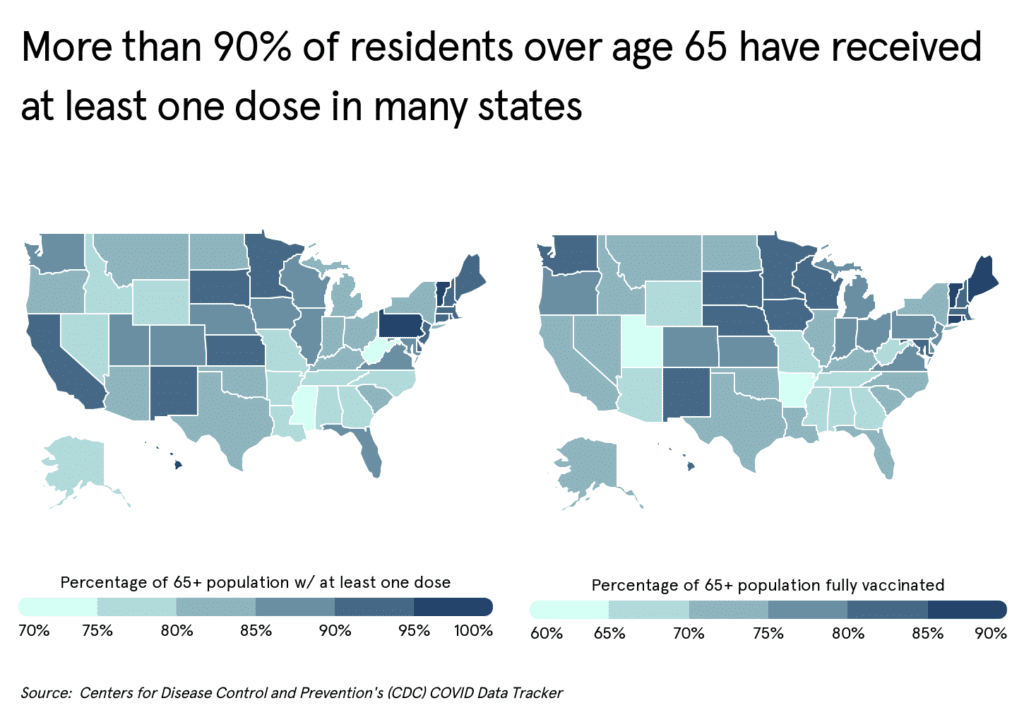
But arguably two of the most important factors in the vaccine rollout have been demographics and geography. In terms of demographics, the vaccination rate for seniors—one of the populations most vulnerable to severe illness and death for COVID-19—outstrips that of the general population, with three in four adults aged 65+ fully vaccinated as of early June. In some leading states like Vermont, Hawaii, and Pennsylvania, more than 95% of the senior population has received at least one dose. Other demographic factors like income levels and educational attainment also show positive relationships with vaccination rates, based on polling data.
Geographically, the success of the vaccine rollout has varied widely from state to state. Some state governments have been much more successful than others in managing the logistics of vaccine administration and launching public education and information campaigns to address vaccine skepticism. A state’s politics also play a role, as states that lean conservative tend to have lower vaccination rates in part due to the politicization of COVID-19 response during the elections.
To determine which states had the highest COVID-19 vaccination rates heading into summer, researchers at Sidecar Health utilized data from the CDC’s COVID Data Tracker and ranked states by the percentage of residents that were fully vaccinated. In the event of a tie, the state with the greater percentage of residents receiving at least one dose was ranked higher.
Here are the 15 states with the highest percentage of residents fully vaccinated for summer.
States With the Highest Vaccination Rates Heading Into Summer

15. Virginia
- Percentage of total population fully vaccinated: 44.8%
- Percentage of total population w/ at least one dose: 55.0%
- Percentage of 65+ population fully vaccinated: 77.5%
- Percentage of 65+ population w/ at least one dose: 87.1%
- Cumulative COVID cases per 100k: 7,910
- Cumulative COVID deaths per 100k: 130

14. Colorado
- Percentage of total population fully vaccinated: 45.0%
- Percentage of total population w/ at least one dose: 53.9%
- Percentage of 65+ population fully vaccinated: 77.0%
- Percentage of 65+ population w/ at least one dose: 85.8%
- Cumulative COVID cases per 100k: 9,407
- Cumulative COVID deaths per 100k: 113

13. Minnesota
- Percentage of total population fully vaccinated: 45.8%
- Percentage of total population w/ at least one dose: 54.2%
- Percentage of 65+ population fully vaccinated: 83.6%
- Percentage of 65+ population w/ at least one dose: 90.1%
- Cumulative COVID cases per 100k: 10,653
- Cumulative COVID deaths per 100k: 133

12. Washington
- Percentage of total population fully vaccinated: 45.9%
- Percentage of total population w/ at least one dose: 56.3%
- Percentage of 65+ population fully vaccinated: 82.1%
- Percentage of 65+ population w/ at least one dose: 88.7%
- Cumulative COVID cases per 100k: 5,710
- Cumulative COVID deaths per 100k: 75

11. New York
- Percentage of total population fully vaccinated: 46.5%
- Percentage of total population w/ at least one dose: 55.4%
- Percentage of 65+ population fully vaccinated: 74.7%
- Percentage of 65+ population w/ at least one dose: 83.2%
- Cumulative COVID cases per 100k: 10,788
- Cumulative COVID deaths per 100k: 272

10. Hawaii
- Percentage of total population fully vaccinated: 47.6%
- Percentage of total population w/ at least one dose: 66.4%
- Percentage of 65+ population fully vaccinated: 81.9%
- Percentage of 65+ population w/ at least one dose: 98.3%
- Cumulative COVID cases per 100k: 2,461
- Cumulative COVID deaths per 100k: 34

9. Maryland
- Percentage of total population fully vaccinated: 47.7%
- Percentage of total population w/ at least one dose: 57.2%
- Percentage of 65+ population fully vaccinated: 81.5%
- Percentage of 65+ population w/ at least one dose: 88.5%
- Cumulative COVID cases per 100k: 7,601
- Cumulative COVID deaths per 100k: 158

8. New Mexico
- Percentage of total population fully vaccinated: 47.7%
- Percentage of total population w/ at least one dose: 57.5%
- Percentage of 65+ population fully vaccinated: 80.1%
- Percentage of 65+ population w/ at least one dose: 90.2%
- Cumulative COVID cases per 100k: 9,673
- Cumulative COVID deaths per 100k: 203

7. New Hampshire
- Percentage of total population fully vaccinated: 48.5%
- Percentage of total population w/ at least one dose: 59.7%
- Percentage of 65+ population fully vaccinated: 80.4%
- Percentage of 65+ population w/ at least one dose: 91.6%
- Cumulative COVID cases per 100k: 7,255
- Cumulative COVID deaths per 100k: 99

6. New Jersey
- Percentage of total population fully vaccinated: 48.5%
- Percentage of total population w/ at least one dose: 59.9%
- Percentage of 65+ population fully vaccinated: 79.7%
- Percentage of 65+ population w/ at least one dose: 90.0%
- Cumulative COVID cases per 100k: 11,434
- Cumulative COVID deaths per 100k: 294
5. Rhode Island
- Percentage of total population fully vaccinated: 51.2%
- Percentage of total population w/ at least one dose: 60.6%
- Percentage of 65+ population fully vaccinated: 87.7%
- Percentage of 65+ population w/ at least one dose: 93.8%
- Cumulative COVID cases per 100k: 14,324
- Cumulative COVID deaths per 100k: 255

4. Massachusetts
- Percentage of total population fully vaccinated: 52.9%
- Percentage of total population w/ at least one dose: 66.0%
- Percentage of 65+ population fully vaccinated: 83.4%
- Percentage of 65+ population w/ at least one dose: 94.6%
- Cumulative COVID cases per 100k: 10,251
- Cumulative COVID deaths per 100k: 259

3. Connecticut
- Percentage of total population fully vaccinated: 53.1%
- Percentage of total population w/ at least one dose: 63.0%
- Percentage of 65+ population fully vaccinated: 86.0%
- Percentage of 65+ population w/ at least one dose: 93.3%
- Cumulative COVID cases per 100k: 9,742
- Cumulative COVID deaths per 100k: 231

2. Maine
- Percentage of total population fully vaccinated: 54.4%
- Percentage of total population w/ at least one dose: 63.1%
- Percentage of 65+ population fully vaccinated: 87.9%
- Percentage of 65+ population w/ at least one dose: 93.4%
- Cumulative COVID cases per 100k: 5,033
- Cumulative COVID deaths per 100k: 61

1. Vermont
- Percentage of total population fully vaccinated: 54.7%
- Percentage of total population w/ at least one dose: 70.0%
- Percentage of 65+ population fully vaccinated: 91.0%
- Percentage of 65+ population w/ at least one dose: 99.9%
- Cumulative COVID cases per 100k: 3,877
- Cumulative COVID deaths per 100k: 40
Methodology & Detailed Findings
The data used in this analysis is from the CDC’s COVID Data Tracker. States were ordered based on the percentage of residents that are fully vaccinated. In the event of a tie, the state with the greater percentage of residents receiving at least one dose was ranked higher. All of the statistics reported are cumulative as of the end of May 2021.

States With the Highest COVID-19 Vaccination Rates Heading Into Summer
| Rank | State | Percentage of total population fully vaccinated | Percentage of total population w/ at least one dose | Percentage of 65+ population fully vaccinated | Percentage of 65+ population w/ at least one dose | Cumulative COVID cases per 100k | Cumulative COVID deaths per 100k |
|---|---|---|---|---|---|---|---|
| 1 | Vermont | 54.7% | 70.0% | 91.0% | 99.9% | 3,877 | 40 |
| 2 | Maine | 54.4% | 63.1% | 87.9% | 93.4% | 5,033 | 61 |
| 3 | Connecticut | 53.1% | 63.0% | 86.0% | 93.3% | 9,742 | 231 |
| 4 | Massachusetts | 52.9% | 66.0% | 83.4% | 94.6% | 10,251 | 259 |
| 5 | Rhode Island | 51.2% | 60.6% | 87.7% | 93.8% | 14,324 | 255 |
| 6 | New Jersey | 48.5% | 59.9% | 79.7% | 90.0% | 11,434 | 294 |
| 7 | New Hampshire | 48.5% | 59.7% | 80.4% | 91.6% | 7,255 | 99 |
| 8 | New Mexico | 47.7% | 57.5% | 80.1% | 90.2% | 9,673 | 203 |
| 9 | Maryland | 47.7% | 57.2% | 81.5% | 88.5% | 7,601 | 158 |
| 10 | Hawaii | 47.6% | 66.4% | 81.9% | 98.3% | 2,461 | 34 |
| 11 | New York | 46.5% | 55.4% | 74.7% | 83.2% | 10,788 | 272 |
| 12 | Washington | 45.9% | 56.3% | 82.1% | 88.7% | 5,710 | 75 |
| 13 | Minnesota | 45.8% | 54.2% | 83.6% | 90.1% | 10,653 | 133 |
| 14 | Colorado | 45.0% | 53.9% | 77.0% | 85.8% | 9,407 | 113 |
| 15 | Virginia | 44.8% | 55.0% | 77.5% | 87.1% | 7,910 | 130 |
| 16 | Oregon | 44.6% | 54.5% | 77.9% | 84.2% | 4,757 | 63 |
| 17 | Wisconsin | 44.3% | 50.9% | 84.5% | 88.8% | 11,576 | 134 |
| 18 | Iowa | 43.5% | 49.0% | 83.2% | 87.4% | 11,766 | 191 |
| 19 | Pennsylvania | 43.3% | 58.1% | 77.6% | 98.2% | 9,378 | 212 |
| 20 | Delaware | 43.0% | 54.4% | 79.6% | 91.4% | 11,161 | 170 |
| 21 | California | 42.7% | 56.4% | 71.7% | 90.6% | 9,319 | 156 |
| 22 | South Dakota | 42.4% | 48.1% | 84.2% | 90.3% | 14,035 | 227 |
| 23 | Nebraska | 42.1% | 48.2% | 80.6% | 86.3% | 11,544 | 116 |
| 24 | Michigan | 41.9% | 48.6% | 77.5% | 82.9% | 9,927 | 203 |
| 25 | Ohio | 40.0% | 45.6% | 77.0% | 82.1% | 9,419 | 169 |
| 26 | Illinois | 39.7% | 54.6% | 70.7% | 87.9% | 10,892 | 198 |
| 27 | Alaska | 39.2% | 46.0% | 74.9% | 79.9% | 9,214 | 49 |
| 28 | Florida | 38.7% | 48.8% | 74.6% | 87.7% | 10,604 | 171 |
| 29 | Kansas | 38.3% | 46.7% | 76.8% | 90.4% | 10,778 | 174 |
| 30 | Kentucky | 38.2% | 46.2% | 74.5% | 83.8% | 10,249 | 151 |
| 31 | Montana | 38.2% | 45.1% | 73.6% | 80.6% | 10,453 | 150 |
| 32 | Nevada | 36.6% | 45.3% | 70.2% | 79.8% | 10,511 | 181 |
| 33 | North Dakota | 36.5% | 42.1% | 73.2% | 82.5% | 14,423 | 198 |
| 34 | North Carolina | 36.0% | 43.3% | 71.1% | 78.9% | 9,546 | 124 |
| 35 | Arizona | 35.8% | 46.0% | 68.8% | 82.2% | 12,089 | 241 |
| 36 | Texas | 35.3% | 44.0% | 70.4% | 81.3% | 10,147 | 173 |
| 37 | Indiana | 35.2% | 41.6% | 76.5% | 80.9% | 11,035 | 201 |
| 38 | Missouri | 34.2% | 42.0% | 69.5% | 78.6% | 9,762 | 147 |
| 39 | West Virginia | 34.0% | 40.5% | 66.8% | 73.9% | 9,000 | 155 |
| 40 | Oklahoma | 33.6% | 41.4% | 70.0% | 81.6% | 11,447 | 184 |
| 41 | South Carolina | 33.5% | 40.7% | 71.7% | 82.3% | 11,511 | 188 |
| 42 | Idaho | 32.6% | 37.5% | 73.5% | 79.0% | 10,744 | 116 |
| 43 | Utah | 32.0% | 44.9% | 59.4% | 86.1% | 12,653 | 71 |
| 44 | Wyoming | 31.8% | 37.0% | 69.8% | 75.4% | 10,392 | 124 |
| 45 | Tennessee | 31.6% | 39.0% | 67.4% | 76.7% | 12,628 | 182 |
| 46 | Georgia | 31.1% | 39.0% | 67.7% | 78.8% | 10,574 | 196 |
| 47 | Louisiana | 31.1% | 35.6% | 72.1% | 76.7% | 10,125 | 227 |
| 48 | Arkansas | 31.0% | 39.4% | 63.3% | 75.9% | 11,304 | 193 |
| 49 | Alabama | 29.2% | 36.0% | 65.2% | 76.0% | 11,089 | 227 |
| 50 | Mississippi | 27.1% | 34.0% | 65.1% | 74.8% | 10,665 | 245 |
*Current as of the end of May 2021
Related Posts