As the U.S. continues to grapple with the COVID-19 pandemic, disparities in who has access to healthcare are more pronounced than ever. Though the federal government and many insurers have worked to keep the costs of testing and treating COVID-19 low to manage the broader public health crisis, the impacts of the pandemic on healthcare could be felt for years to come.
One of the most noteworthy challenges over the past year has been widespread losses of jobs and income as a result of COVID-19 shutdowns and business failures. With those economic shocks come reduced access to health insurance. Healthcare coverage is closely linked to employment in the United States, with more than 55% of Americans having employer-sponsored health coverage. Permanent job losses resulting from COVID-19 shutdowns and business failures now total in the millions, which creates an enormous barrier to health insurance coverage for many Americans. And for those who did not already have coverage through an employer and those who find themselves without health insurance due to job loss, the costs of purchasing health policies can be prohibitively expensive.
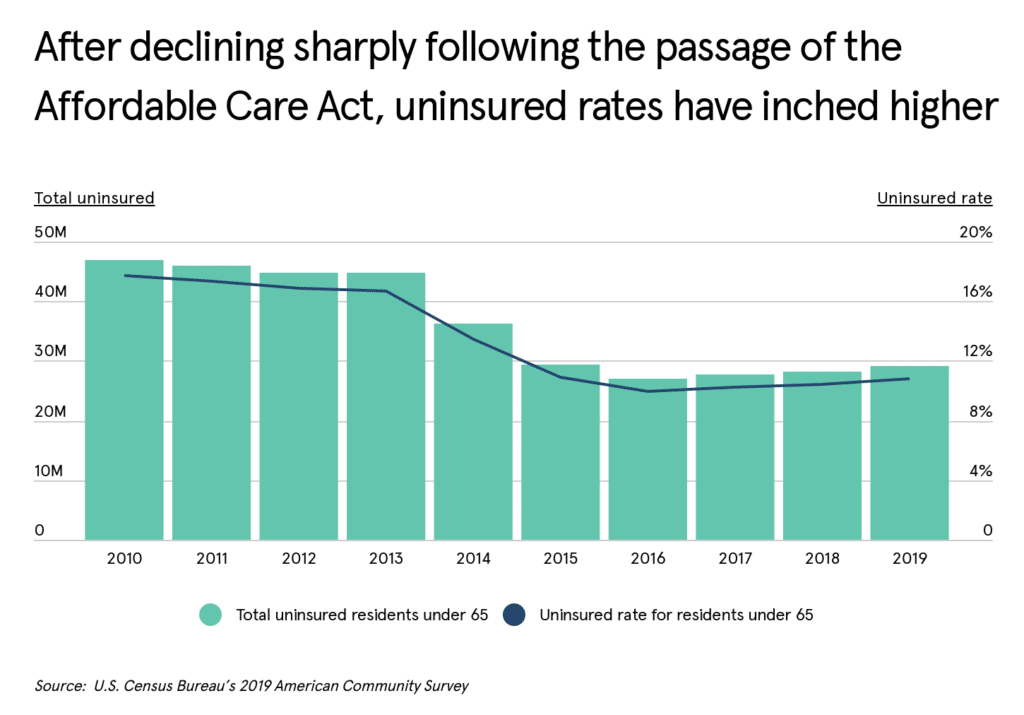
This situation is especially worrying because the uninsured rate in the U.S. had already been increasing in the past few years. After a dramatic reduction in the number and rate of uninsured in the first few years after the passage of the Affordable Care Act in 2010, both figures began to increase again beginning in 2016. In 2019, the number of uninsured topped 29 million Americans, and data for 2020 and 2021 are likely to be even higher given COVID’s effects.
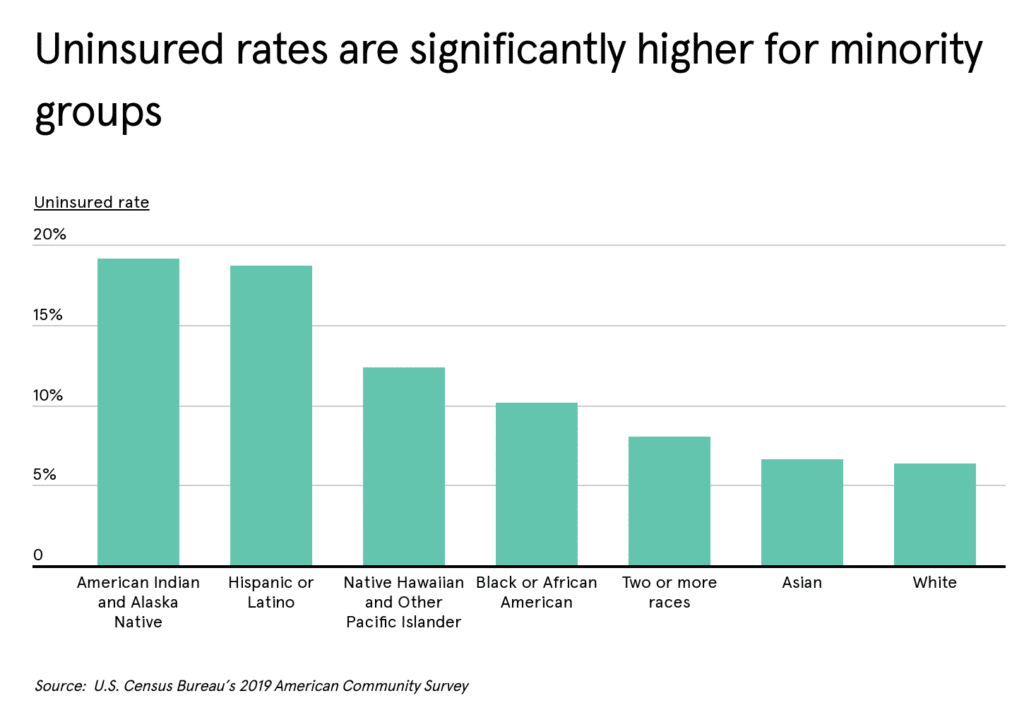
Another concerning issue is the significant disparities in coverage between different racial and ethnic groups. Non-Hispanic Whites currently have the lowest uninsured rate at 6.3%, followed closely by Asian Americans at 6.6% and people of two or more races at 8.0%. The other racial and ethnic subgroups—American Indians, Hispanic and Latino, Pacific Islanders, and Blacks—all have uninsured rates above 10%. One of the reasons is that people in these groups are more likely to work in lower-wage jobs that do not come with insurance benefits and do not provide enough income to afford private coverage.
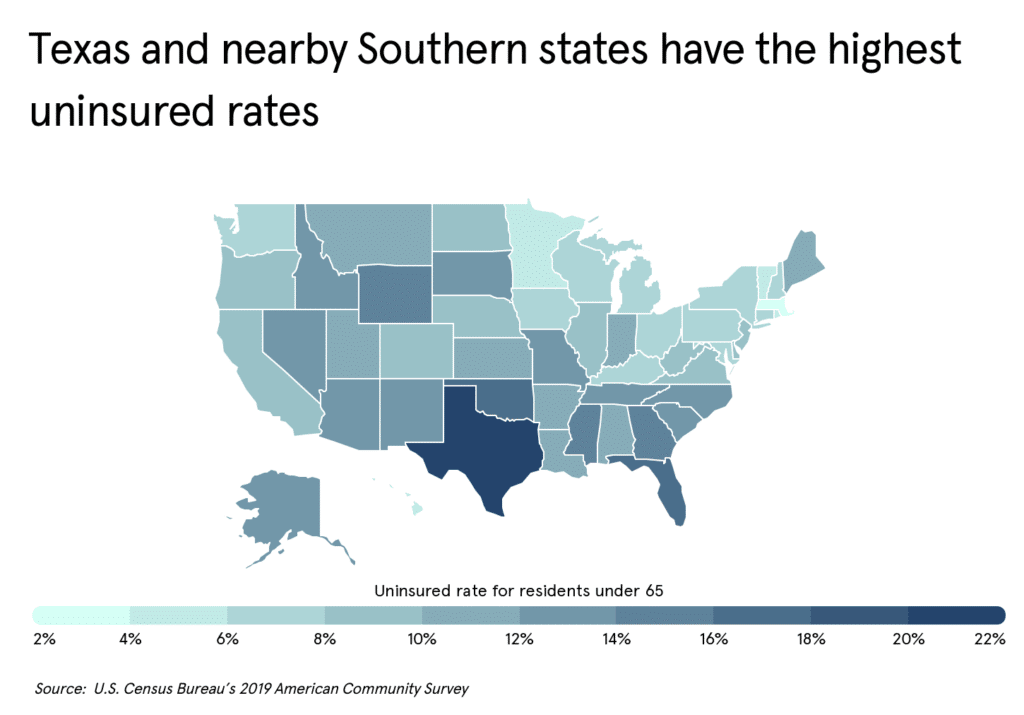
Disparities in insurance coverage also show up across state lines. Income and employment levels and racial demographics predictably provide some of the explanation for these differences. The impact of these factors is exacerbated in the South, where most states have declined to expand eligibility for the federal Medicaid program as allowed under the Affordable Care Act. This has made it more difficult for lower-income workers in Southern states to obtain affordable coverage, as they are ineligible for Medicaid but unable to afford private coverage. As a result, states in the South tend to have higher uninsured rates, led by Texas—a state with no Medicaid expansion and one of the nation’s most diverse populations—at 20.8%.
At the city level, it is unsurprising to find that Texas is also home to six of the top 10 locations with the highest rate of uninsured residents. At the other end of the spectrum, the cities with the lowest uninsured rates are those that tend to be economically prosperous, with good, professional jobs offering high wages and insurance benefits.
To find the cities with the highest and lowest uninsured rates, researchers at Sidecar Health used data from the U.S. Census Bureau’s American Community Survey. The research team calculated the uninsured rate for residents under 65 to rank the cities and additionally gathered data on the total number of uninsured residents, the uninsured rate for the unemployed, and the uninsured rate for children under 18.
Here are the cities with the highest and lowest uninsured rates.

Large cities with the highest uninsured rates

1. Houston, TX
- Uninsured rate for residents under 65: 28.1%
- Total residents under 65 without health insurance: 573,715
- Uninsured rate for the unemployed: 57.0%
- Uninsured rate for children under 18: 16.2%
2. Dallas, TX
- Uninsured rate for residents under 65: 27.3%
- Total residents under 65 without health insurance: 325,228
- Uninsured rate for the unemployed: 55.1%
- Uninsured rate for children under 18: 17.4%
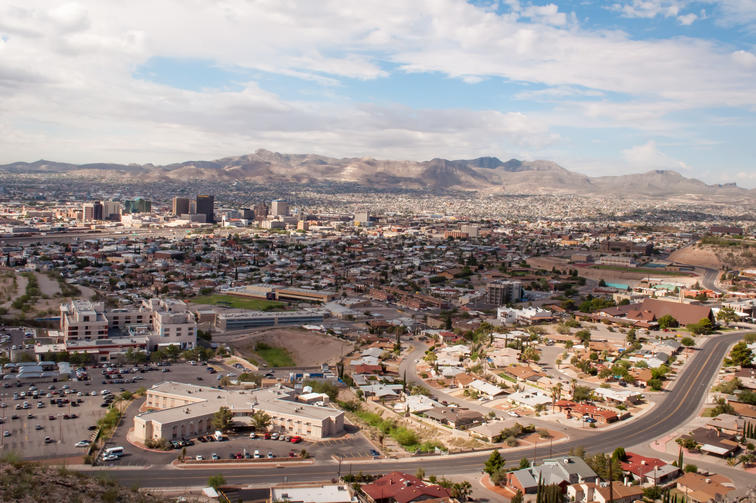
3. El Paso, TX
- Uninsured rate for residents under 65: 25.1%
- Total residents under 65 without health insurance: 144,769
- Uninsured rate for the unemployed: 57.3%
- Uninsured rate for children under 18: 12.4%

4. Miami, FL
- Uninsured rate for residents under 65: 22.6%
- Total residents under 65 without health insurance: 86,282
- Uninsured rate for the unemployed: 47.6%
- Uninsured rate for children under 18: 10.3%
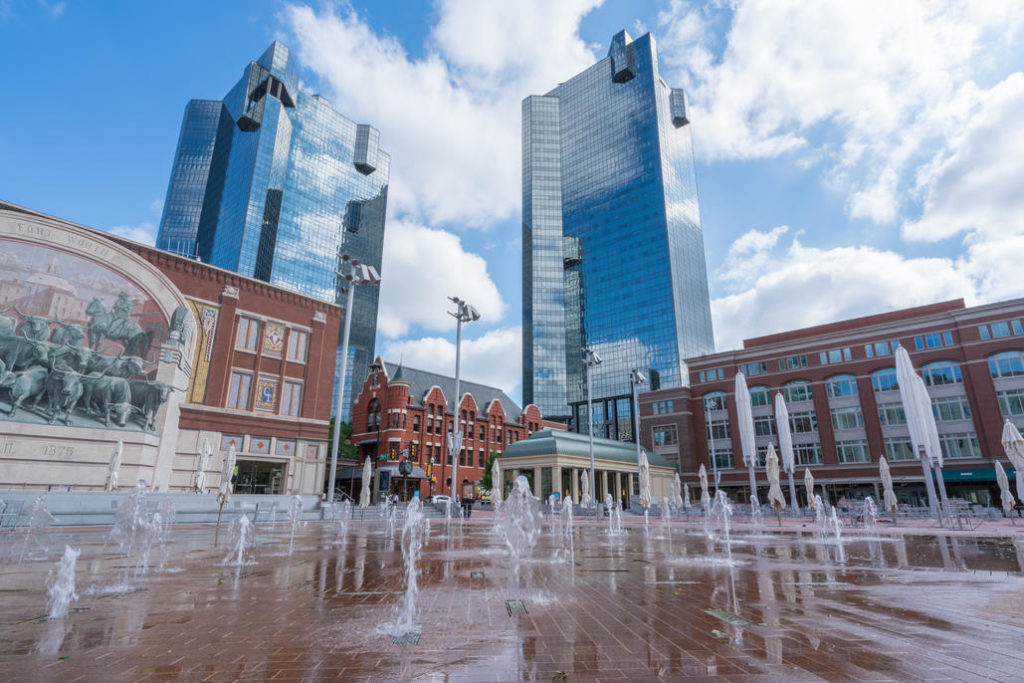
5. Fort Worth, TX
- Uninsured rate for residents under 65: 21.3%
- Total residents under 65 without health insurance: 172,804
- Uninsured rate for the unemployed: 50.5%
- Uninsured rate for children under 18: 13.5%
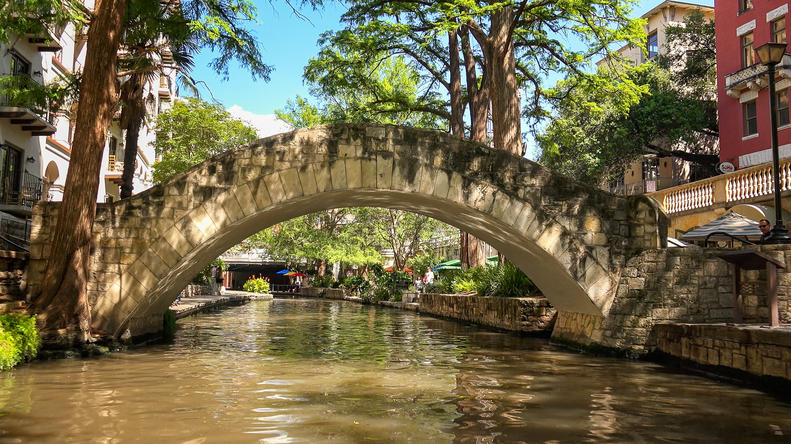
6. San Antonio, TX
- Uninsured rate for residents under 65: 20.9%
- Total residents under 65 without health insurance: 279,367
- Uninsured rate for the unemployed: 53.3%
- Uninsured rate for children under 18: 10.1%
7. Arlington, TX
- Uninsured rate for residents under 65: 20.5%
- Total residents under 65 without health insurance: 72,182
- Uninsured rate for the unemployed: 41.9%
- Uninsured rate for children under 18: 12.4%

8. Tulsa, OK
- Uninsured rate for residents under 65: 19.2%
- Total residents under 65 without health insurance: 65,075
- Uninsured rate for the unemployed: 52.2%
- Uninsured rate for children under 18: 8.5%

9. Phoenix, AZ
- Uninsured rate for residents under 65: 17.1%
- Total residents under 65 without health insurance: 253,915
- Uninsured rate for the unemployed: 27.5%
- Uninsured rate for children under 18: 10.6%
10. Oklahoma City, OK
- Uninsured rate for residents under 65: 16.8%
- Total residents under 65 without health insurance: 93,990
- Uninsured rate for the unemployed: 47.1%
- Uninsured rate for children under 18: 8.0%
Large cities with the lowest uninsured rates
1. Washington, DC
- Uninsured rate for residents under 65: 3.9%
- Total residents under 65 without health insurance: 23,824
- Uninsured rate for the unemployed: 15.4%
- Uninsured rate for children under 18: 2.0%

2. San Francisco, CA
- Uninsured rate for residents under 65: 4.3%
- Total residents under 65 without health insurance: 31,822
- Uninsured rate for the unemployed: 14.3%
- Uninsured rate for children under 18: 0.9%

3. Seattle, WA
- Uninsured rate for residents under 65: 4.6%
- Total residents under 65 without health insurance: 30,191
- Uninsured rate for the unemployed: 12.7%
- Uninsured rate for children under 18: 1.3%
4. Boston, MA
- Uninsured rate for residents under 65: 4.6%
- Total residents under 65 without health insurance: 28,181
- Uninsured rate for the unemployed: 10.2%
- Uninsured rate for children under 18: 2.4%

5. San Jose, CA
- Uninsured rate for residents under 65: 6.2%
- Total residents under 65 without health insurance: 54,723
- Uninsured rate for the unemployed: 11.2%
- Uninsured rate for children under 18: 2.0%

6. Baltimore, MD
- Uninsured rate for residents under 65: 6.6%
- Total residents under 65 without health insurance: 33,133
- Uninsured rate for the unemployed: 18.0%
- Uninsured rate for children under 18: 4.1%
7. Sacramento, CA
- Uninsured rate for residents under 65: 7.0%
- Total residents under 65 without health insurance: 30,754
- Uninsured rate for the unemployed: 16.3%
- Uninsured rate for children under 18: 3.0%
8. Louisville, KY
- Uninsured rate for residents under 65: 7.2%
- Total residents under 65 without health insurance: 37,022
- Uninsured rate for the unemployed: 23.2%
- Uninsured rate for children under 18: 3.9%

9. Oakland, CA
- Uninsured rate for residents under 65: 7.3%
- Total residents under 65 without health insurance: 27,036
- Uninsured rate for the unemployed: 15.1%
- Uninsured rate for children under 18: 4.1%

10. Minneapolis, MN
- Uninsured rate for residents under 65: 7.4%
- Total residents under 65 without health insurance: 28,307
- Uninsured rate for the unemployed: 13.5%
- Uninsured rate for children under 18: 2.1%
Detailed Findings & Methodology
The data used in this analysis is from the U.S. Census Bureau’s 2019 American Community Survey. To identify cities with the highest uninsured rates, researchers calculated the uninsured rate for residents under 65. In the event of a tie, the location with more total residents under 65 without health insurance was ranked higher. While the city and state-level statistics were calculated for the civilian noninstitutionalized population under 65 only, the uninsured rates by race/ethnicity shown in the charts are for all ages. To improve relevance, only cities with at least 100,000 residents were included. Additionally, cities were grouped into cohorts based on population size: small (100,000–149,999), midsize (150,000–349,999), and large (350,000 or more).

Cities with the highest and lowest uninsured rates
| Rank | City | Uninsured rate for residents under 65 | Total residents under 65 without health insurance | Uninsured rate for the unemployed | Uninsured rate for children under 18 |
|---|---|---|---|---|---|
| 1 | Brownsville, TX | 36.70% | 58,433 | 62.50% | 20.30% |
| 2 | Laredo, TX | 31.20% | 73,807 | 62.20% | 17.90% |
| 3 | Pasadena, TX | 30.90% | 41,523 | 74.30% | 15.60% |
| 4 | McAllen, TX | 30.10% | 36,406 | 64.20% | 10.60% |
| 5 | Garland, TX | 29.60% | 62,523 | 55.80% | 18.50% |
| 6 | Pompano Beach, FL | 28.20% | 24,111 | 38.60% | 12.40% |
| 7 | Houston, TX | 28.10% | 573,715 | 57.00% | 16.20% |
| 8 | Dallas, TX | 27.30% | 325,228 | 55.10% | 17.40% |
| 9 | Mesquite, TX | 25.40% | 30,174 | 65.40% | 17.00% |
| 10 | El Paso, TX | 25.10% | 144,769 | 57.30% | 12.40% |
| 11 | North Charleston, SC | 24.60% | 25,051 | 58.80% | 21.30% |
| 12 | Hialeah, FL | 24.10% | 44,330 | 32.80% | 9.30% |
| 13 | Irving, TX | 23.90% | 52,875 | 34.40% | 16.30% |
| 14 | Beaumont, TX | 23.20% | 22,904 | 55.30% | 10.70% |
| 15 | Paterson, NJ | 23.10% | 29,502 | 41.50% | 8.80% |
| 16 | Sunrise Manor, NV | 22.90% | 38,433 | 30.50% | 11.70% |
| 17 | Elizabeth, NJ | 22.80% | 26,229 | 49.80% | 8.20% |
| 18 | Miami, FL | 22.60% | 86,282 | 47.60% | 10.30% |
| 19 | Kansas City, KS | 21.40% | 28,494 | 43.00% | 14.00% |
| 20 | Hollywood, FL | 21.30% | 27,804 | 56.50% | 7.60% |
| 21 | Fort Worth, TX | 21.30% | 172,804 | 50.50% | 13.50% |
| 22 | Santa Maria, CA | 21.10% | 20,101 | 46.70% | 4.10% |
| 23 | Newark, NJ | 21.10% | 51,662 | 32.90% | 12.10% |
| 24 | Tyler, TX | 21.10% | 18,427 | 32.20% | 15.00% |
| 25 | Corpus Christi, TX | 21.00% | 57,649 | 49.30% | 9.60% |
| 26 | West Valley City, UT | 21.00% | 25,755 | 66.60% | 19.00% |
| 27 | San Antonio, TX | 20.90% | 279,367 | 53.30% | 10.10% |
| 28 | Fort Lauderdale, FL | 20.70% | 30,279 | 51.90% | 22.90% |
| 29 | Lehigh Acres, FL | 20.70% | 24,021 | 49.30% | 11.90% |
| 30 | Miami Gardens, FL | 20.60% | 19,266 | 59.20% | 6.70% |
| 31 | Arlington, TX | 20.50% | 72,182 | 41.90% | 12.40% |
| 32 | Grand Prairie, TX | 19.90% | 35,345 | 44.60% | 12.60% |
| 33 | Amarillo, TX | 19.50% | 32,317 | 58.90% | 13.80% |
| 34 | Springfield, MO | 19.50% | 27,248 | 25.70% | 15.20% |
| 35 | Tulsa, OK | 19.20% | 65,075 | 52.20% | 8.50% |
| 36 | Abilene, TX | 19.10% | 17,902 | 25.10% | 10.40% |
| 37 | Miramar, FL | 19.00% | 23,734 | 43.50% | 8.00% |
| 38 | Oxnard, CA | 19.00% | 35,240 | 39.10% | 5.70% |
| 39 | Odessa, TX | 18.60% | 20,412 | 77.50% | 12.60% |
| 40 | Denton, TX | 18.50% | 22,853 | 22.30% | 12.80% |
| 41 | East Los Angeles, CA | 18.50% | 19,878 | 33.20% | 4.50% |
| 42 | West Palm Beach, FL | 18.00% | 16,497 | 33.60% | 8.70% |
| 43 | Killeen, TX | 17.90% | 23,448 | 39.90% | 10.10% |
| 44 | Savannah, GA | 17.80% | 21,023 | 63.20% | 5.90% |
| 45 | Lewisville, TX | 17.80% | 17,506 | 17.30% | 14.90% |
| 46 | Jackson, MS | 17.60% | 24,094 | 41.70% | 6.20% |
| 47 | Paradise , NV | 17.20% | 35,360 | 31.00% | 13.20% |
| 48 | Phoenix, AZ | 17.10% | 253,915 | 27.50% | 10.60% |
| 49 | Jurupa Valley, CA | 17.00% | 16,504 | 37.70% | 8.60% |
| 50 | Midland, TX | 17.00% | 22,039 | 45.20% | 18.10% |
| 51 | Carrollton, TX | 17.00% | 20,841 | 37.50% | 11.90% |
| 52 | Oklahoma City, OK | 16.80% | 93,990 | 47.10% | 8.00% |
| 53 | Memphis, TN | 16.70% | 92,045 | 40.00% | 7.80% |
| 54 | Glendale, AZ | 16.20% | 35,136 | 23.50% | 14.10% |
| 55 | Waco, TX | 16.10% | 19,405 | 51.10% | 6.60% |
| 56 | Bridgeport, CT | 16.10% | 20,222 | 13.60% | 5.10% |
| 57 | Independence, MO | 16.00% | 15,409 | 50.50% | 11.60% |
| 58 | Lubbock, TX | 15.80% | 35,858 | 50.60% | 9.40% |
| 59 | Birmingham, AL | 15.70% | 27,621 | 52.50% | 3.10% |
| 60 | Lakeland, FL | 15.70% | 13,654 | 40.20% | 4.50% |
| 61 | Richardson, TX | 15.70% | 16,245 | 24.60% | 14.40% |
| 62 | High Point, NC | 15.60% | 14,675 | 19.50% | 4.60% |
| 63 | Cape Coral, FL | 15.60% | 23,027 | 39.50% | 9.10% |
| 64 | Winston-Salem, NC | 15.40% | 32,785 | 48.50% | 5.30% |
| 65 | Costa Mesa, CA | 15.20% | 14,997 | 21.80% | 7.40% |
| 66 | Chattanooga, TN | 15.20% | 22,638 | 34.10% | 7.80% |
| 67 | Orlando, FL | 15.10% | 39,128 | 30.70% | 5.20% |
| 68 | Las Vegas, NV | 15.10% | 82,721 | 23.30% | 7.60% |
| 69 | Macon-Bibb, GA | 15.00% | 19,033 | 52.80% | 3.60% |
| 70 | Austin, TX | 15.00% | 132,457 | 32.30% | 10.60% |
| 71 | Tucson, AZ | 15.00% | 67,015 | 28.60% | 7.90% |
| 72 | Mesa, AZ | 14.90% | 64,268 | 32.90% | 10.80% |
| 73 | Metairie, LA | 14.90% | 15,398 | 38.30% | 5.80% |
| 74 | Escondido, CA | 14.90% | 19,025 | 31.60% | 5.00% |
| 75 | Palm Bay, FL | 14.80% | 13,520 | 47.80% | 2.50% |
| 76 | Aurora, CO | 14.70% | 48,915 | 38.10% | 10.80% |
| 77 | Jacksonville, FL | 14.70% | 111,850 | 44.80% | 6.70% |
| 78 | Elgin, IL | 14.60% | 13,933 | 43.10% | 3.20% |
| 79 | Durham, NC | 14.60% | 35,471 | 31.40% | 8.30% |
| 80 | Brandon, FL | 14.30% | 14,303 | 34.30% | 4.20% |
| 81 | Charlotte, NC | 14.30% | 112,697 | 35.40% | 7.50% |
| 82 | Athens, GA | 14.30% | 16,025 | 36.70% | 7.20% |
| 83 | Rialto, CA | 14.30% | 13,330 | 37.60% | 4.70% |
| 84 | Spring Hill, FL | 14.30% | 12,125 | 29.10% | 6.40% |
| 85 | Salinas, CA | 14.00% | 19,984 | 34.50% | 1.90% |
| 86 | Wichita, KS | 14.00% | 45,937 | 42.00% | 6.40% |
| 87 | North Las Vegas, NV | 13.90% | 30,640 | 26.60% | 7.90% |
| 88 | Pembroke Pines, FL | 13.80% | 19,728 | 35.90% | 11.40% |
| 89 | Santa Ana, CA | 13.80% | 40,700 | 24.90% | 4.60% |
| 90 | Stamford, CT | 13.80% | 15,164 | 36.70% | 6.80% |
| 91 | Spring Valley, NV | 13.70% | 26,018 | 30.00% | 6.40% |
| 92 | Fayetteville, NC | 13.70% | 22,039 | 30.30% | 3.50% |
| 93 | Kansas City, MO | 13.70% | 58,240 | 43.80% | 7.20% |
| 94 | Coral Springs, FL | 13.60% | 15,939 | 34.10% | 8.70% |
| 95 | Baton Rouge, LA | 13.50% | 25,282 | 25.10% | 6.70% |
| 96 | Port St. Lucie, FL | 13.40% | 20,791 | 14.90% | 6.30% |
| 97 | Tampa, FL | 13.30% | 45,885 | 40.10% | 6.90% |
| 98 | Davie, FL | 13.30% | 12,521 | 52.50% | 4.90% |
| 99 | West Jordan, UT | 13.20% | 14,016 | 70.30% | 9.40% |
| 100 | Richmond, VA | 13.20% | 26,029 | 45.60% | 8.80% |
| 101 | Allentown, PA | 13.20% | 14,056 | 26.10% | 5.20% |
| 102 | El Monte, CA | 13.20% | 12,762 | 22.00% | 0.80% |
| 103 | Clearwater, FL | 13.20% | 11,688 | 36.60% | 4.80% |
| 104 | Evansville, IN | 13.10% | 12,809 | 36.50% | 2.70% |
| 105 | St. Petersburg, FL | 13.00% | 27,369 | 51.40% | 5.20% |
| 106 | Nashville, TN | 13.00% | 75,583 | 35.40% | 7.00% |
| 107 | Downey, CA | 13.00% | 12,642 | 28.70% | 4.80% |
| 108 | San Bernardino, CA | 13.00% | 24,211 | 21.10% | 4.50% |
| 109 | Augusta-Richmond, GA | 12.90% | 20,434 | 44.10% | 5.90% |
| 110 | Salt Lake City, UT | 12.90% | 22,778 | 14.70% | 14.10% |
| 111 | Anaheim, CA | 12.80% | 39,397 | 24.90% | 5.20% |
| 112 | Los Angeles, CA | 12.70% | 438,384 | 18.20% | 4.40% |
| 113 | Manchester, NH | 12.70% | 12,115 | 30.80% | 7.10% |
| 114 | Plano, TX | 12.50% | 30,602 | 22.80% | 7.70% |
| 115 | South Bend, IN | 12.40% | 10,873 | 11.20% | 8.20% |
| 116 | Broken Arrow, OK | 12.40% | 11,647 | 37.70% | 9.30% |
| 117 | Pomona, CA | 12.30% | 16,300 | 24.60% | 5.70% |
| 118 | Moreno Valley, CA | 12.30% | 23,901 | 30.10% | 6.00% |
| 119 | Reno, NV | 12.20% | 26,288 | 17.60% | 9.40% |
| 120 | Mobile, AL | 12.20% | 18,899 | 32.50% | 1.20% |
| 121 | Oceanside, CA | 12.20% | 17,353 | 37.70% | 4.40% |
| 122 | Inglewood, CA | 12.20% | 11,555 | 36.30% | 4.30% |
| 123 | Victorville, CA | 12.20% | 13,003 | 8.20% | 5.40% |
| 124 | Greensboro, NC | 12.10% | 30,865 | 24.10% | 3.80% |
| 125 | Boise City, ID | 12.10% | 23,572 | 26.80% | 6.00% |
| 126 | Norwalk, CA | 12.10% | 10,847 | 17.80% | 2.70% |
| 127 | Indianapolis, IN | 12.00% | 90,384 | 31.50% | 7.00% |
| 128 | Norfolk, VA | 12.00% | 22,243 | 39.50% | 3.80% |
| 129 | St. Louis, MO | 12.00% | 30,477 | 39.40% | 6.80% |
| 130 | Knoxville, TN | 12.00% | 18,944 | 51.50% | 2.90% |
| 131 | Omaha, NE | 12.00% | 48,964 | 53.70% | 6.10% |
| 132 | Anchorage, AK | 11.90% | 29,163 | 29.00% | 7.10% |
| 133 | Murfreesboro, TN | 11.90% | 15,423 | 13.30% | 5.10% |
| 134 | Grand Rapids, MI | 11.80% | 20,500 | 22.40% | 4.20% |
| 135 | Columbus, GA | 11.80% | 18,868 | 35.60% | 3.20% |
| 136 | Newport News, VA | 11.80% | 17,126 | 16.90% | 6.30% |
| 137 | Joliet, IL | 11.70% | 15,348 | 19.50% | 8.10% |
| 138 | Montgomery, AL | 11.70% | 19,123 | 28.50% | 2.90% |
| 139 | Jersey City, NJ | 11.60% | 26,838 | 36.70% | 4.50% |
| 140 | Vancouver, WA | 11.60% | 17,829 | 26.10% | 3.20% |
| 141 | Dayton, OH | 11.60% | 13,855 | 11.30% | 9.70% |
| 142 | Long Beach, CA | 11.50% | 46,239 | 29.80% | 3.90% |
| 143 | Raleigh, NC | 11.50% | 47,421 | 24.80% | 6.50% |
| 144 | McKinney, TX | 11.40% | 19,973 | 17.90% | 8.80% |
| 145 | Huntsville, AL | 11.40% | 18,592 | 44.10% | 4.80% |
| 146 | Wilmington, NC | 11.30% | 11,483 | 31.30% | 3.10% |
| 147 | Milwaukee, WI | 11.30% | 59,171 | 32.50% | 3.80% |
| 148 | Richmond, CA | 11.30% | 10,877 | 22.50% | 2.70% |
| 149 | Round Rock, TX | 11.20% | 13,658 | 32.30% | 3.40% |
| 150 | Akron, OH | 11.10% | 18,448 | 18.20% | 1.20% |
| 151 | Gainesville, FL | 11.10% | 13,110 | 34.70% | 6.00% |
| 152 | Provo, UT | 11.00% | 11,927 | 16.70% | 10.30% |
| 153 | Lakewood, CO | 11.00% | 14,303 | 12.30% | 9.70% |
| 154 | Chicago, IL | 11.00% | 253,337 | 21.80% | 3.90% |
| 155 | Glendale, CA | 10.90% | 17,766 | 25.20% | 3.60% |
| 156 | Aurora, IL | 10.90% | 19,439 | 32.40% | 3.30% |
| 157 | Atlanta, GA | 10.90% | 47,643 | 49.10% | 4.40% |
| 158 | Orange, CA | 10.80% | 12,528 | 16.40% | 5.80% |
| 159 | Gresham, OR | 10.80% | 10,006 | 38.10% | 1.30% |
| 160 | Greeley, CO | 10.80% | 10,176 | 30.90% | 5.60% |
| 161 | Kent, WA | 10.70% | 12,570 | 19.10% | 3.70% |
| 162 | Tallahassee, FL | 10.70% | 18,226 | 17.80% | 4.50% |
| 163 | Allen, TX | 10.60% | 10,179 | 45.60% | 6.20% |
| 164 | Fort Wayne, IN | 10.60% | 23,745 | 28.70% | 4.60% |
| 165 | Bend, OR | 10.60% | 8,989 | 0.00% | 3.70% |
| 166 | Green Bay, WI | 10.60% | 9,340 | 19.80% | 5.10% |
| 167 | Colorado Springs, CO | 10.50% | 41,378 | 19.60% | 5.70% |
| 168 | Garden Grove, CA | 10.40% | 14,775 | 28.30% | 6.00% |
| 169 | Hartford, CT | 10.20% | 10,927 | 19.80% | 1.50% |
| 170 | Tempe, AZ | 10.20% | 17,667 | 12.90% | 6.80% |
| 171 | Columbus, OH | 10.20% | 81,692 | 21.50% | 5.40% |
| 172 | New Haven, CT | 10.20% | 11,645 | 33.30% | 0.70% |
| 173 | Toledo, OH | 10.10% | 23,292 | 30.40% | 5.80% |
| 174 | Clarksville, TN | 10.10% | 13,461 | 39.70% | 4.10% |
| 175 | Little Rock, AR | 10.10% | 16,859 | 26.30% | 6.20% |
| 176 | Columbia, SC | 10.10% | 9,720 | 25.10% | 2.40% |
| 177 | Pueblo, CO | 10.00% | 9,081 | 21.70% | 2.50% |
| 178 | Topeka, KS | 10.00% | 10,035 | 34.30% | 3.80% |
| 179 | Chandler, AZ | 10.00% | 22,789 | 12.90% | 7.60% |
| 180 | New Orleans, LA | 10.00% | 32,705 | 27.80% | 4.00% |
| 181 | Spokane Valley, WA | 10.00% | 8,382 | 26.70% | 1.70% |
| 182 | Surprise, AZ | 10.00% | 10,982 | 37.70% | 9.10% |
| 183 | Ontario, CA | 10.00% | 16,769 | 35.80% | 3.80% |
| 184 | Riverside, CA | 9.90% | 29,102 | 21.40% | 2.70% |
| 185 | Bakersfield, CA | 9.80% | 33,540 | 32.50% | 3.40% |
| 186 | The Woodlands, TX | 9.80% | 9,680 | 3.90% | 11.10% |
| 187 | Corona, CA | 9.80% | 15,059 | 37.70% | 3.70% |
| 188 | Albuquerque, NM | 9.70% | 45,425 | 19.20% | 3.60% |
| 189 | Charleston, SC | 9.60% | 11,486 | 41.60% | 4.10% |
| 190 | Lansing, MI | 9.60% | 9,779 | 22.10% | 2.80% |
| 191 | Meridian, ID | 9.60% | 9,561 | 54.30% | 3.50% |
| 192 | San Tan Valley, AZ | 9.60% | 8,540 | 24.80% | 6.60% |
| 193 | Thornton, CO | 9.60% | 12,013 | 7.10% | 4.40% |
| 194 | Denver, CO | 9.50% | 60,240 | 15.10% | 4.80% |
| 195 | Detroit, MI | 9.40% | 53,847 | 17.10% | 3.50% |
| 196 | Pasadena, CA | 9.40% | 11,132 | 20.70% | 0.80% |
| 197 | Sioux Falls, SD | 9.40% | 14,713 | 61.50% | 7.40% |
| 198 | Alexandria, VA | 9.40% | 12,836 | 22.00% | 2.80% |
| 199 | Philadelphia, PA | 9.30% | 125,852 | 17.80% | 4.40% |
| 200 | College Station, TX | 9.30% | 10,060 | 31.60% | 5.50% |
| 201 | Enterprise, NV | 9.20% | 16,143 | 12.20% | 7.00% |
| 202 | Norman, OK | 9.20% | 9,872 | 35.10% | 4.40% |
| 203 | Frisco, TX | 9.20% | 16,777 | 26.90% | 6.80% |
| 204 | Sugar Land, TX | 9.10% | 9,066 | 7.60% | 6.40% |
| 205 | San Diego, CA | 9.10% | 108,754 | 25.80% | 3.70% |
| 206 | Lincoln, NE | 9.10% | 22,232 | 31.80% | 6.30% |
| 207 | Fresno, CA | 9.10% | 42,113 | 17.40% | 3.70% |
| 208 | Olathe, KS | 9.00% | 11,097 | 46.40% | 6.10% |
| 209 | Santa Rosa, CA | 9.00% | 13,094 | 22.60% | 6.30% |
| 210 | Cincinnati, OH | 8.90% | 23,350 | 14.60% | 7.20% |
| 211 | Fontana, CA | 8.90% | 17,157 | 24.40% | 3.10% |
| 212 | Everett, WA | 8.90% | 8,335 | 21.40% | 2.60% |
| 213 | Chula Vista, CA | 8.80% | 20,560 | 31.30% | 4.10% |
| 214 | Yonkers, NY | 8.80% | 14,635 | 13.20% | 3.60% |
| 215 | Chesapeake, VA | 8.80% | 17,544 | 35.80% | 5.60% |
| 216 | Shreveport, LA | 8.70% | 13,220 | 7.90% | 2.10% |
| 217 | Lexington-Fayette, KY | 8.60% | 23,853 | 26.60% | 4.10% |
| 218 | San Buenaventura, CA | 8.60% | 7,621 | 20.80% | 3.40% |
| 219 | Antioch, CA | 8.60% | 8,129 | 22.90% | 4.80% |
| 220 | Peoria, AZ | 8.60% | 11,982 | 27.10% | 5.20% |
| 221 | Sparks, NV | 8.50% | 7,561 | 18.60% | 1.70% |
| 222 | Tuscaloosa, AL | 8.40% | 7,303 | 30.80% | 5.70% |
| 223 | Sterling Heights, MI | 8.40% | 9,029 | 27.60% | 3.00% |
| 224 | Eugene, OR | 8.40% | 11,766 | 18.40% | 3.30% |
| 225 | Davenport, IA | 8.40% | 7,148 | 25.00% | 5.80% |
| 226 | Las Cruces, NM | 8.30% | 7,161 | 12.70% | 0.70% |
| 227 | Cleveland, OH | 8.30% | 26,782 | 20.00% | 3.60% |
| 228 | Warren, MI | 8.20% | 9,309 | 13.30% | 4.60% |
| 229 | Tacoma, WA | 8.20% | 15,274 | 19.00% | 2.90% |
| 230 | Modesto, CA | 8.10% | 14,871 | 15.80% | 3.70% |
| 231 | Pearland, TX | 8.10% | 9,516 | 41.30% | 6.20% |
| 232 | Arvada, CO | 8.10% | 8,130 | 21.00% | 8.00% |
| 233 | Henderson, NV | 8.10% | 20,196 | 28.80% | 5.70% |
| 234 | Waterbury, CT | 8.00% | 7,348 | 13.00% | 1.00% |
| 235 | Sandy Springs, GA | 7.90% | 7,524 | 20.60% | 3.10% |
| 236 | New York, NY | 7.90% | 552,670 | 15.20% | 2.00% |
| 237 | Hampton, VA | 7.80% | 8,296 | 19.60% | 2.90% |
| 238 | Lafayette, LA | 7.70% | 7,852 | 31.70% | 1.00% |
| 239 | Columbia, MO | 7.60% | 8,375 | 32.00% | 4.70% |
| 240 | Fargo, ND | 7.60% | 8,132 | 38.80% | 5.80% |
| 241 | Des Moines, IA | 7.60% | 13,918 | 27.90% | 1.70% |
| 242 | St. Paul, MN | 7.60% | 20,616 | 23.10% | 4.50% |
| 243 | Palmdale, CA | 7.50% | 10,530 | 20.20% | 2.20% |
| 244 | Renton, WA | 7.50% | 6,586 | 2.70% | 1.80% |
| 245 | El Cajon, CA | 7.50% | 6,651 | 33.70% | 2.50% |
| 246 | Virginia Beach, VA | 7.50% | 26,730 | 29.20% | 3.30% |
| 247 | Portland, OR | 7.50% | 41,916 | 21.00% | 3.20% |
| 248 | Westminster, CO | 7.40% | 7,359 | 11.60% | 4.10% |
| 249 | Burbank, CA | 7.40% | 6,215 | 4.20% | 3.00% |
| 250 | Minneapolis, MN | 7.40% | 28,307 | 13.50% | 2.10% |
| 251 | Murrieta, CA | 7.40% | 7,430 | 28.40% | 1.50% |
| 252 | Rochester, MN | 7.30% | 7,257 | 14.60% | 2.20% |
| 253 | Stockton, CA | 7.30% | 19,721 | 17.40% | 2.70% |
| 254 | Rockford, IL | 7.30% | 8,695 | 13.10% | 1.90% |
| 255 | Oakland, CA | 7.30% | 27,036 | 15.10% | 4.10% |
| 256 | Salem, OR | 7.20% | 10,639 | 11.20% | 2.70% |
| 257 | Louisville, KY | 7.20% | 37,022 | 23.20% | 3.90% |
| 258 | Daly City, CA | 7.20% | 6,294 | 0.00% | 2.70% |
| 259 | Peoria, IL | 7.10% | 6,503 | 11.70% | 5.40% |
| 260 | Chico, CA | 7.10% | 6,287 | 26.40% | 4.60% |
| 261 | Fullerton, CA | 7.10% | 8,440 | 34.80% | 4.50% |
| 262 | Sacramento, CA | 7.00% | 30,754 | 16.30% | 3.00% |
| 263 | Cary, NC | 7.00% | 10,515 | 23.50% | 4.50% |
| 264 | Providence, RI | 6.80% | 10,619 | 13.50% | 1.30% |
| 265 | Spokane, WA | 6.70% | 12,290 | 15.40% | 2.20% |
| 266 | Baltimore, MD | 6.60% | 33,133 | 18.00% | 4.10% |
| 267 | Simi Valley, CA | 6.60% | 6,948 | 13.60% | 3.60% |
| 268 | Santa Clarita, CA | 6.40% | 11,801 | 6.40% | 2.90% |
| 269 | Pittsburgh, PA | 6.40% | 16,048 | 24.10% | 3.80% |
| 270 | Temecula, CA | 6.40% | 6,445 | 6.90% | 5.10% |
| 271 | Fort Collins, CO | 6.30% | 9,407 | 16.00% | 3.60% |
| 272 | Cedar Rapids, IA | 6.30% | 7,004 | 19.90% | 1.50% |
| 273 | West Covina, CA | 6.20% | 5,486 | 24.20% | 2.90% |
| 274 | Syracuse, NY | 6.20% | 7,585 | 17.60% | 1.90% |
| 275 | Scottsdale, AZ | 6.20% | 11,614 | 20.60% | 2.70% |
| 276 | San Jose, CA | 6.20% | 54,723 | 11.20% | 2.00% |
| 277 | Lowell, MA | 6.20% | 6,035 | 16.70% | 1.80% |
| 278 | Hillsboro, OR | 6.20% | 5,903 | 23.50% | 3.00% |
| 279 | League City, TX | 6.20% | 5,778 | 0.00% | 6.40% |
| 280 | San Mateo, CA | 6.10% | 5,423 | 0.00% | 2.00% |
| 281 | Arlington, VA | 6.10% | 12,559 | 25.30% | 2.40% |
| 282 | Vallejo, CA | 6.10% | 6,194 | 31.10% | 2.40% |
| 283 | Springfield, IL | 6.00% | 5,465 | 33.40% | 2.10% |
| 284 | Overland Park, KS | 6.00% | 9,989 | 24.60% | 3.90% |
| 285 | Irvine, CA | 5.90% | 15,163 | 18.60% | 2.40% |
| 286 | Visalia, CA | 5.80% | 6,881 | 13.40% | 1.60% |
| 287 | Thousand Oaks, CA | 5.80% | 5,889 | 8.50% | 1.90% |
| 288 | Gilbert, AZ | 5.70% | 12,926 | 10.10% | 4.70% |
| 289 | Columbia, MD | 5.70% | 5,048 | 8.70% | 3.40% |
| 290 | Fairfield, CA | 5.60% | 5,571 | 10.50% | 1.20% |
| 291 | Urban Honolulu, HI | 5.50% | 14,483 | 29.90% | 2.70% |
| 292 | Carlsbad, CA | 5.50% | 5,151 | 20.30% | 4.00% |
| 293 | Torrance, CA | 5.50% | 6,419 | 23.00% | 2.70% |
| 294 | Rancho Cucamonga, CA | 5.30% | 7,983 | 18.80% | 3.10% |
| 295 | Arden-Arcade, CA | 5.30% | 4,829 | 6.30% | 1.50% |
| 296 | Huntington Beach, CA | 5.30% | 8,488 | 7.30% | 2.20% |
| 297 | Billings, MT | 5.30% | 4,708 | 6.10% | 0.10% |
| 298 | Concord, CA | 5.10% | 5,610 | 9.10% | 1.30% |
| 299 | Rochester, NY | 4.80% | 8,519 | 8.20% | 1.00% |
| 300 | Hayward, CA | 4.70% | 6,549 | 16.30% | 3.70% |
| 301 | Boston, MA | 4.60% | 28,181 | 10.20% | 2.40% |
| 302 | Seattle, WA | 4.60% | 30,191 | 12.70% | 1.30% |
| 303 | Boulder, CO | 4.50% | 4,159 | 10.20% | 1.30% |
| 304 | Ann Arbor, MI | 4.40% | 4,687 | 14.40% | 2.10% |
| 305 | Santa Clara, CA | 4.40% | 5,123 | 5.10% | 0.70% |
| 306 | Centennial, CO | 4.30% | 3,948 | 7.30% | 2.90% |
| 307 | San Francisco, CA | 4.30% | 31,822 | 14.30% | 0.90% |
| 308 | Bellevue, WA | 4.30% | 5,453 | 30.00% | 0.90% |
| 309 | Sunnyvale, CA | 4.30% | 5,838 | 7.90% | 1.20% |
| 310 | Madison, WI | 4.10% | 9,457 | 6.60% | 1.50% |
| 311 | Springfield, MA | 4.10% | 5,489 | 4.00% | 1.50% |
| 312 | Roseville, CA | 4.00% | 4,682 | 15.60% | 2.30% |
| 313 | Washington, DC | 3.90% | 23,824 | 15.40% | 2.00% |
| 314 | Worcester, MA | 3.80% | 6,114 | 10.30% | 0.70% |
| 315 | Buffalo, NY | 3.70% | 8,231 | 8.40% | 0.60% |
| 316 | Lancaster, CA | 3.70% | 4,978 | 19.00% | 1.10% |
| 317 | Carmel, IN | 3.40% | 2,948 | 15.30% | 2.60% |
| 318 | Berkeley, CA | 3.00% | 3,108 | 17.10% | 1.90% |
| 319 | Clovis, CA | 2.90% | 2,894 | 20.40% | 1.60% |
| 320 | Elk Grove, CA | 2.90% | 4,474 | 22.10% | 0.50% |
| 321 | Naperville, IL | 2.50% | 3,222 | 0.00% | 0.70% |
| 322 | Fremont, CA | 1.60% | 3,325 | 5.70% | 0.60% |
| 323 | Cambridge, MA | 1.40% | 1,476 | 5.10% | 0.80% |
Source: U.S. Census Bureau’s 2019 American Community Survey
Related Posts