Photo Credit: Alamy Stock Photo
Over the past year, COVID-19 has put a spotlight on public health and the economy, emphasizing how important it is for people to have access to high-quality healthcare that they can afford.
The government and many insurers have worked to ensure that treatment related to COVID-19 itself is affordable, but the pandemic may have other long-range impacts on healthcare economics in the future. Many people have lost employer insurance coverage or the income to afford insurance as a result of COVID-19’s economic shocks, and even when the threat of the pandemic passes, those who contracted COVID-19 may carry long-term heart, lung, and brain conditions related to the disease. These effects could increase the cost of care or make it more difficult for people to afford the healthcare they need. On the flip side, many health providers have been pushed to adopt telemedicine at a wide scale during the pandemic, a development that could lead to future cost savings for some forms of care.
How these potential shifts play out is important because U.S. households already face tremendous barriers to accessing and affording healthcare. Despite the Affordable Care Act’s successes in reducing the number of uninsured in America since 2010, around 29 million people still lack insurance coverage. Troublingly, spending on healthcare continues to increase whether people are insured or not.
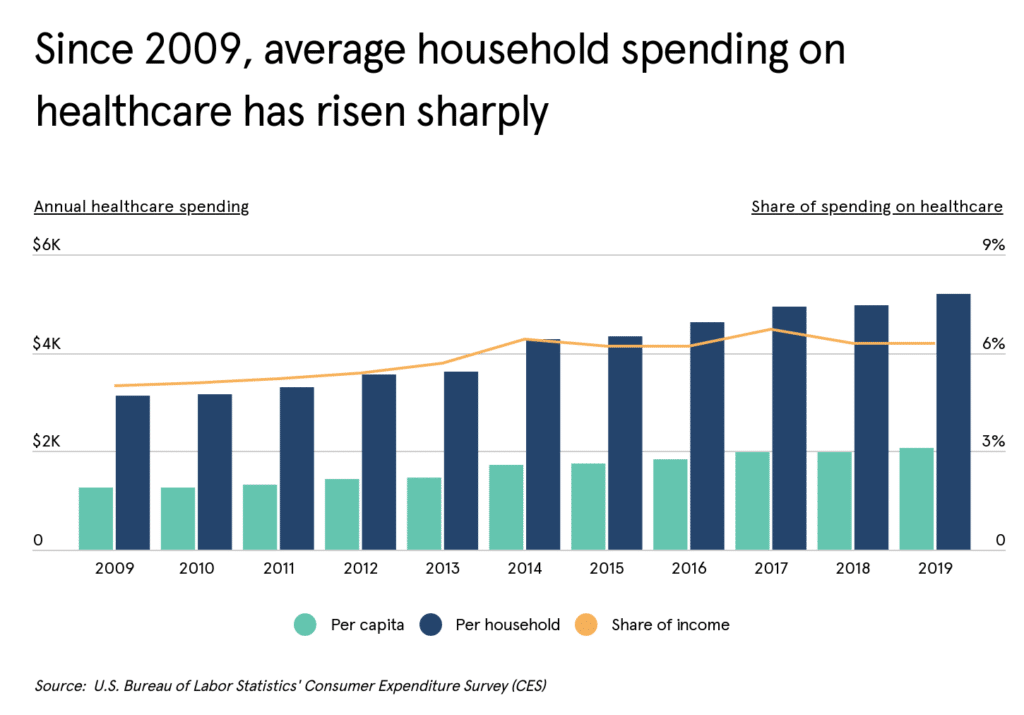
The ACA’s failures to slow the increase in health spending are evident by multiple measures. Household healthcare spending as a share of income increased from 5% to 6.3% between 2009—the last year before the ACA’s passage—and 2019. In dollars, individual spending is up from $1,250 per person per year to $2,077 over the same span, while spending per household has increased from $3,126 to $5,193.

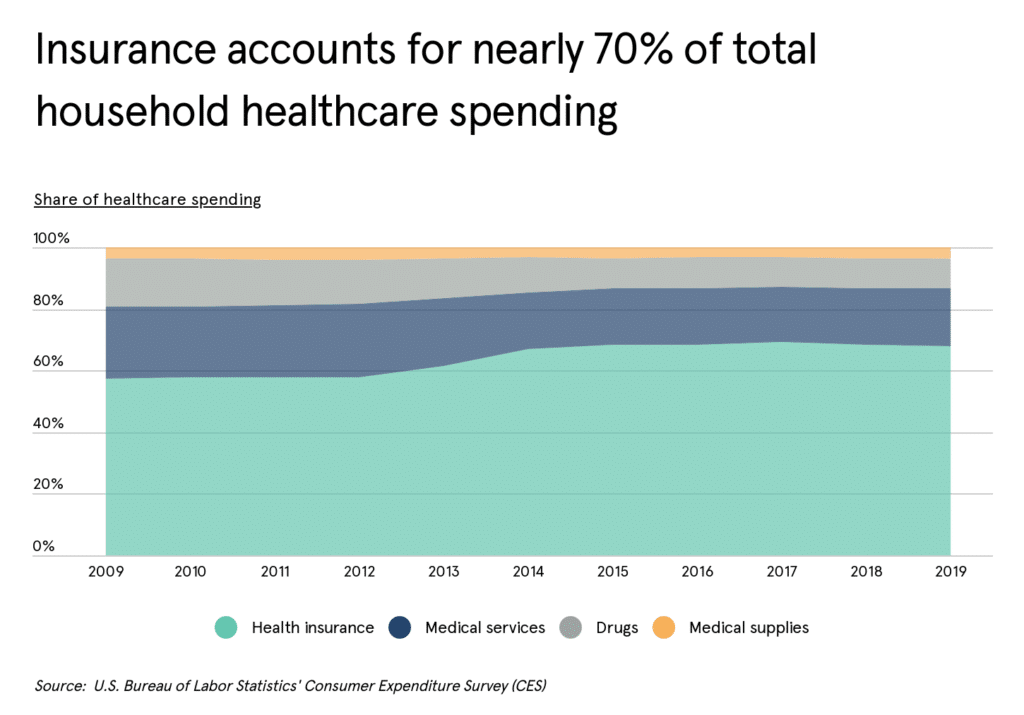
The main driver of this increase in health spending is not new treatments, devices, drugs, or other innovations to improve quality; it’s the cost of health insurance coverage. Health insurance spending as a share of total health spending has creeped upward over the last decade, from 57% in 2009 to 67% in 2019. While the insurance exchanges in the ACA were intended to contain or even reduce insurance costs, spending on insurance has nearly doubled since 2009, from $714 to $1,412.

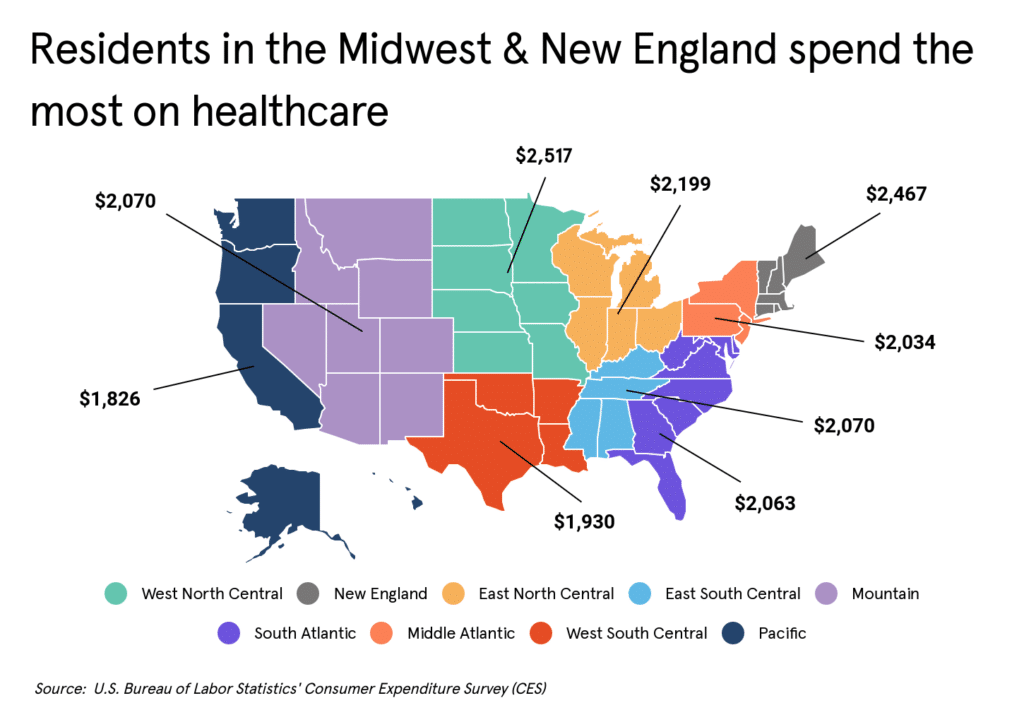
Healthcare spending shows some regional variation, from a high of $2,517 in the Census’s West North Central region to a low of $1,826 in the Pacific region. These differences may be attributable to an area’s demographic and economic characteristics. On the demographic side, age may be a key driver. Older populations, like those of most states in the New England region, may have a greater need for health treatments as an effect of aging. Healthcare spending is also related to an area’s economic conditions. The states of the upper West North Central region have some of the lowest unemployment rates in the country. This means that residents in those states are more likely to have insurance coverage, along with steady income to afford care.

The economic factors behind healthcare spending are even more apparent at the metro level. The cities with the greatest spending per capita on healthcare tend to have higher concentrations of professional jobs with health coverage and higher income levels than other cities in the U.S. With insurance coverage and greater financial resources, residents of these metros are more likely to invest in their own health.
To identify these locations, researchers at Sidecar Health used data from the U.S. Bureau of Labor Statistics’ Consumer Expenditure Survey and found average individual healthcare spending per capita, per household, as a share of income, and as a share of expenses. Metros were ranked based on per capita spending.
Here are the metropolitan areas that spend the most on healthcare.
Large metros with the highest per capita healthcare spending

10. Seattle-Tacoma-Bellevue, WA
- Annual healthcare spending per capita: $2,142
- Annual healthcare spending per household: $5,140
- Annual healthcare spending as a share of income: 4.5%
- Annual healthcare spending as a share of total expenses: 6.3%
- Mean household income: $115,137

9. Philadelphia-Camden-Wilmington, PA-NJ-DE-MD
- Annual healthcare spending per capita: $2,244
- Annual healthcare spending per household: $5,609
- Annual healthcare spending as a share of income: 5.7%
- Annual healthcare spending as a share of total expenses: 7.7%
- Mean household income: $98,206

8. Baltimore-Columbia-Towson, MD
- Annual healthcare spending per capita: $2,260
- Annual healthcare spending per household: $5,650
- Annual healthcare spending as a share of income: 4.9%
- Annual healthcare spending as a share of total expenses: 7.3%
- Mean household income: $115,285

7. Dallas-Fort Worth-Arlington, TX
- Annual healthcare spending per capita: $2,294
- Annual healthcare spending per household: $5,734
- Annual healthcare spending as a share of income: 6.4%
- Annual healthcare spending as a share of total expenses: 8.6%
- Mean household income: $89,438

6. St. Louis, MO-IL
- Annual healthcare spending per capita: $2,375
- Annual healthcare spending per household: $5,700
- Annual healthcare spending as a share of income: 6.4%
- Annual healthcare spending as a share of total expenses: 8.8%
- Mean household income: $88,772

5. Phoenix-Mesa-Scottsdale, AZ
- Annual healthcare spending per capita: $2,389
- Annual healthcare spending per household: $5,972
- Annual healthcare spending as a share of income: 8.0%
- Annual healthcare spending as a share of total expenses: 9.0%
- Mean household income: $74,635

4. Denver-Aurora-Lakewood, CO
- Annual healthcare spending per capita: $2,391
- Annual healthcare spending per household: $5,977
- Annual healthcare spending as a share of income: 5.6%
- Annual healthcare spending as a share of total expenses: 7.8%
- Mean household income: $106,128

3. Washington-Arlington-Alexandria, DC-VA-MD-WV
- Annual healthcare spending per capita: $2,523
- Annual healthcare spending per household: $6,813
- Annual healthcare spending as a share of income: 5.3%
- Annual healthcare spending as a share of total expenses: 7.1%
- Mean household income: $128,871

2. Minneapolis-St. Paul-Bloomington, MN-WI
- Annual healthcare spending per capita: $2,803
- Annual healthcare spending per household: $6,448
- Annual healthcare spending as a share of income: 5.9%
- Annual healthcare spending as a share of total expenses: 7.7%
- Mean household income: $108,799

1. Boston-Cambridge-Newton, MA-NH
- Annual healthcare spending per capita: $2,813
- Annual healthcare spending per household: $6,470
- Annual healthcare spending as a share of income: 6.2%
- Annual healthcare spending as a share of total expenses: 7.8%
- Mean household income: $104,623
Methodology & Detailed Findings
The data used in this analysis is from the latest U.S. Bureau of Labor Statistics’ Consumer Expenditure Survey (CES), a program which provides data on household expenditures, income, and demographics for select geographic areas. To identify the metropolitan areas spending the most per capita on healthcare, researchers at Sidecar Health divided the average annual household healthcare spending by the average number of individuals per household. In the event of a tie, locations with the greater total household healthcare spending were ranked higher. Researchers also calculated annual healthcare spending as a percentage of both pre-tax income and total annual expenditure. Healthcare spending includes money spent on health insurance, medical services, drugs, and medical supplies. Only the nation’s largest 20 metropolitan areas were included in the analysis.

Cities that spend the most on healthcare
| Rank | Metro | Annual healthcare spending per capita | Annual healthcare spending per household | Annual healthcare spending as a share of income | Annual healthcare spending as a share of total expenses | Mean household income |
|---|---|---|---|---|---|---|
| 1 | Boston-Cambridge-Newton, MA-NH | $2,813 | $6,470 | 6.20% | 7.80% | $104,623 |
| 2 | Minneapolis-St. Paul-Bloomington, MN-WI | $2,803 | $6,448 | 5.90% | 7.70% | $108,799 |
| 3 | Washington-Arlington-Alexandria, DC-VA-MD-WV | $2,523 | $6,813 | 5.30% | 7.10% | $128,871 |
| 4 | Denver-Aurora-Lakewood, CO | $2,391 | $5,977 | 5.60% | 7.80% | $106,128 |
| 5 | Phoenix-Mesa-Scottsdale, AZ | $2,389 | $5,972 | 8.00% | 9.00% | $74,635 |
| 6 | St. Louis, MO-IL | $2,375 | $5,700 | 6.40% | 8.80% | $88,772 |
| 7 | Dallas-Fort Worth-Arlington, TX | $2,294 | $5,734 | 6.40% | 8.60% | $89,438 |
| 8 | Baltimore-Columbia-Towson, MD | $2,260 | $5,650 | 4.90% | 7.30% | $115,285 |
| 9 | Philadelphia-Camden-Wilmington, PA-NJ-DE-MD | $2,244 | $5,609 | 5.70% | 7.70% | $98,206 |
| 10 | Seattle-Tacoma-Bellevue, WA | $2,142 | $5,140 | 4.50% | 6.30% | $115,137 |
| 11 | San Francisco-Oakland-Hayward, CA | $2,130 | $4,898 | 3.60% | 5.60% | $138,041 |
| 12 | Chicago-Naperville-Elgin, IL-IN-WI | $2,117 | $5,504 | 6.40% | 8.50% | $86,575 |
| 13 | Atlanta-Sandy Springs-Roswell, GA | $2,089 | $5,222 | 5.80% | 8.20% | $90,098 |
| 14 | Detroit-Warren-Dearborn, MI | $2,017 | $5,042 | 5.80% | 7.70% | $87,214 |
| 15 | Miami-Fort Lauderdale-West Palm Beach, FL | $1,923 | $4,807 | 6.50% | 8.40% | $73,793 |
| 16 | New York-Newark-Jersey City, NY-NJ-PA | $1,891 | $4,728 | 4.60% | 6.40% | $103,011 |
| 17 | Tampa-St. Petersburg-Clearwater, FL | $1,876 | $4,315 | 6.90% | 7.30% | $62,894 |
| 18 | Houston-The Woodlands-Sugar Land, TX | $1,830 | $4,942 | 5.10% | 6.60% | $96,464 |
| 19 | San Diego-Carlsbad, CA | $1,787 | $4,645 | 4.80% | 6.00% | $97,853 |
| 20 | Los Angeles-Long Beach-Anaheim, CA | $1,434 | $4,158 | 4.60% | 6.00% | $90,037 |
Source: U.S. Bureau of Labor Statistics’ Consumer Expenditure Survey (CES)
Get a Quote
Want to know how much you can save with Sidecar Health? Enter your zip code to find quotes in your area.


